User Manual
The manual includes specific instructions on how to use our tools to achieve comprehensive Data Analysis related to EstroGene.
Gene of Instrest
EstroGeneDB supports analysis regarding to 3 types of data: MicroArray, RNA-seq, and Chip-seq Data. Click the SEARCH button on the top bar to enter the search page.
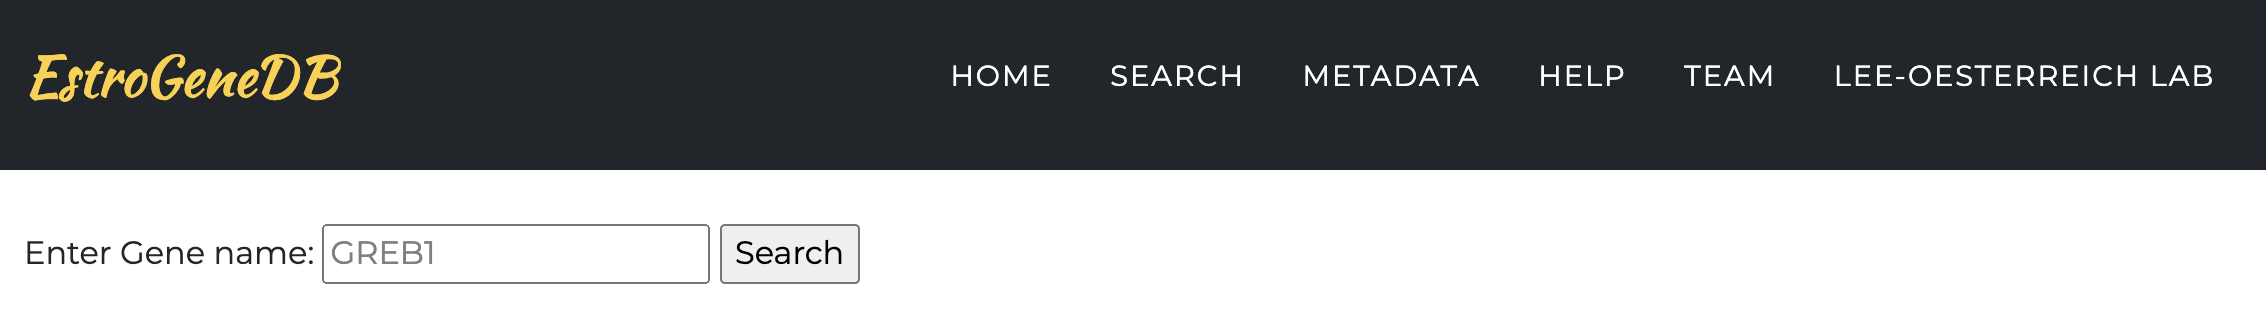
Enter the gene of interest into the search box, hit the search button on the right to start automatic query in our precomputed database.
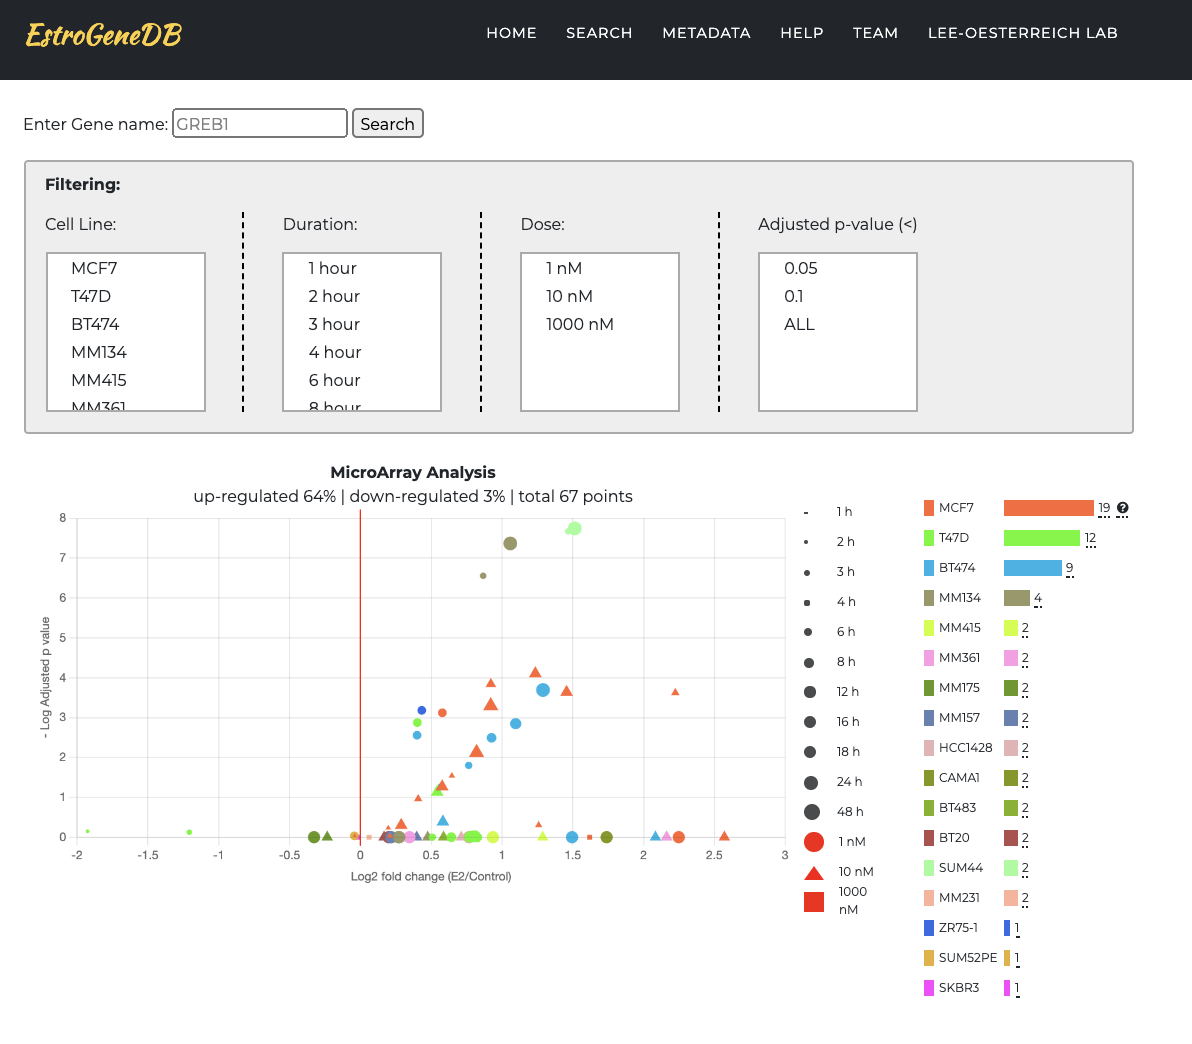
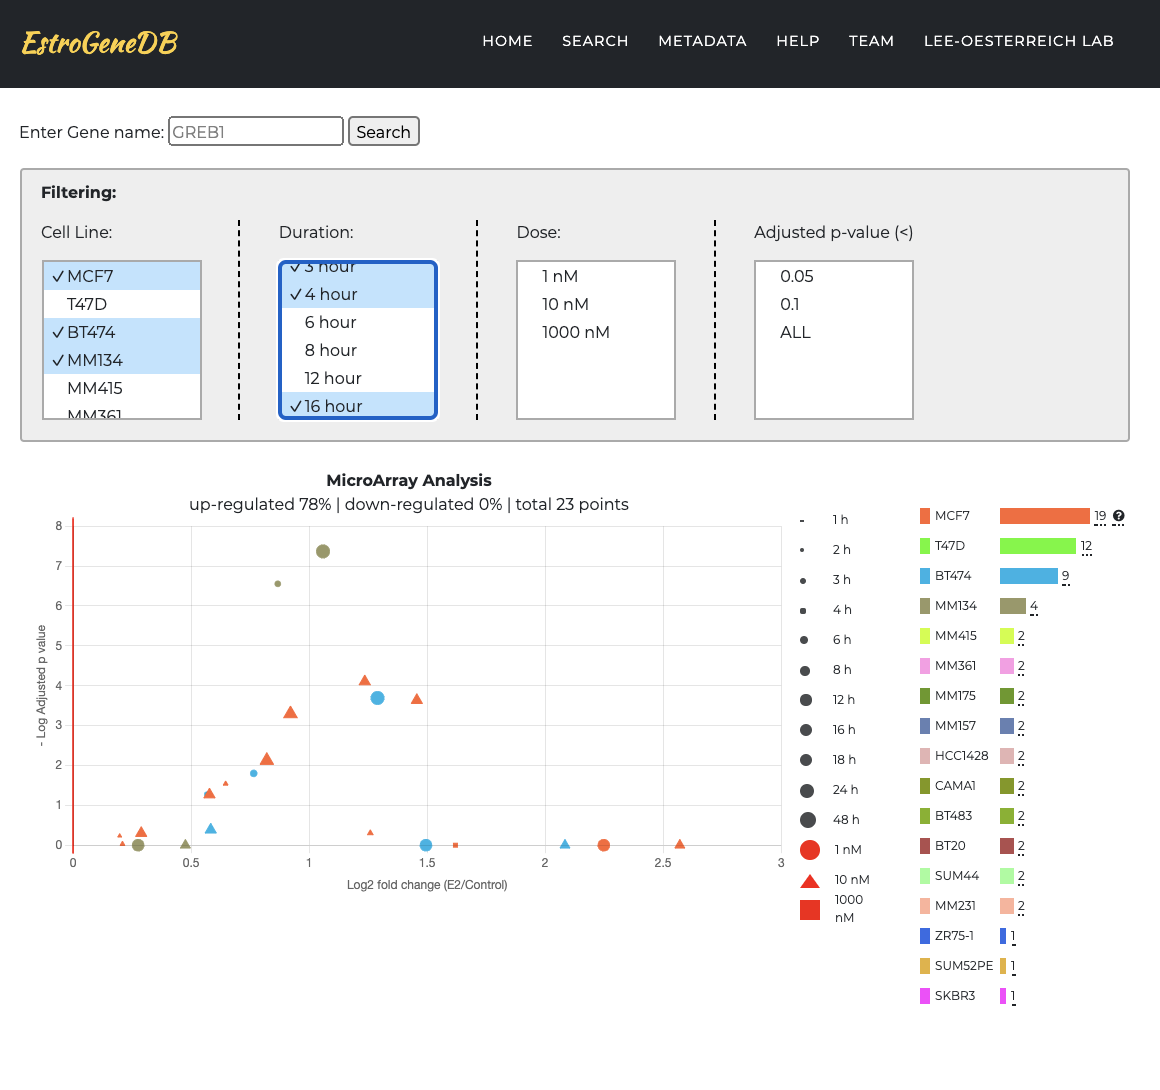
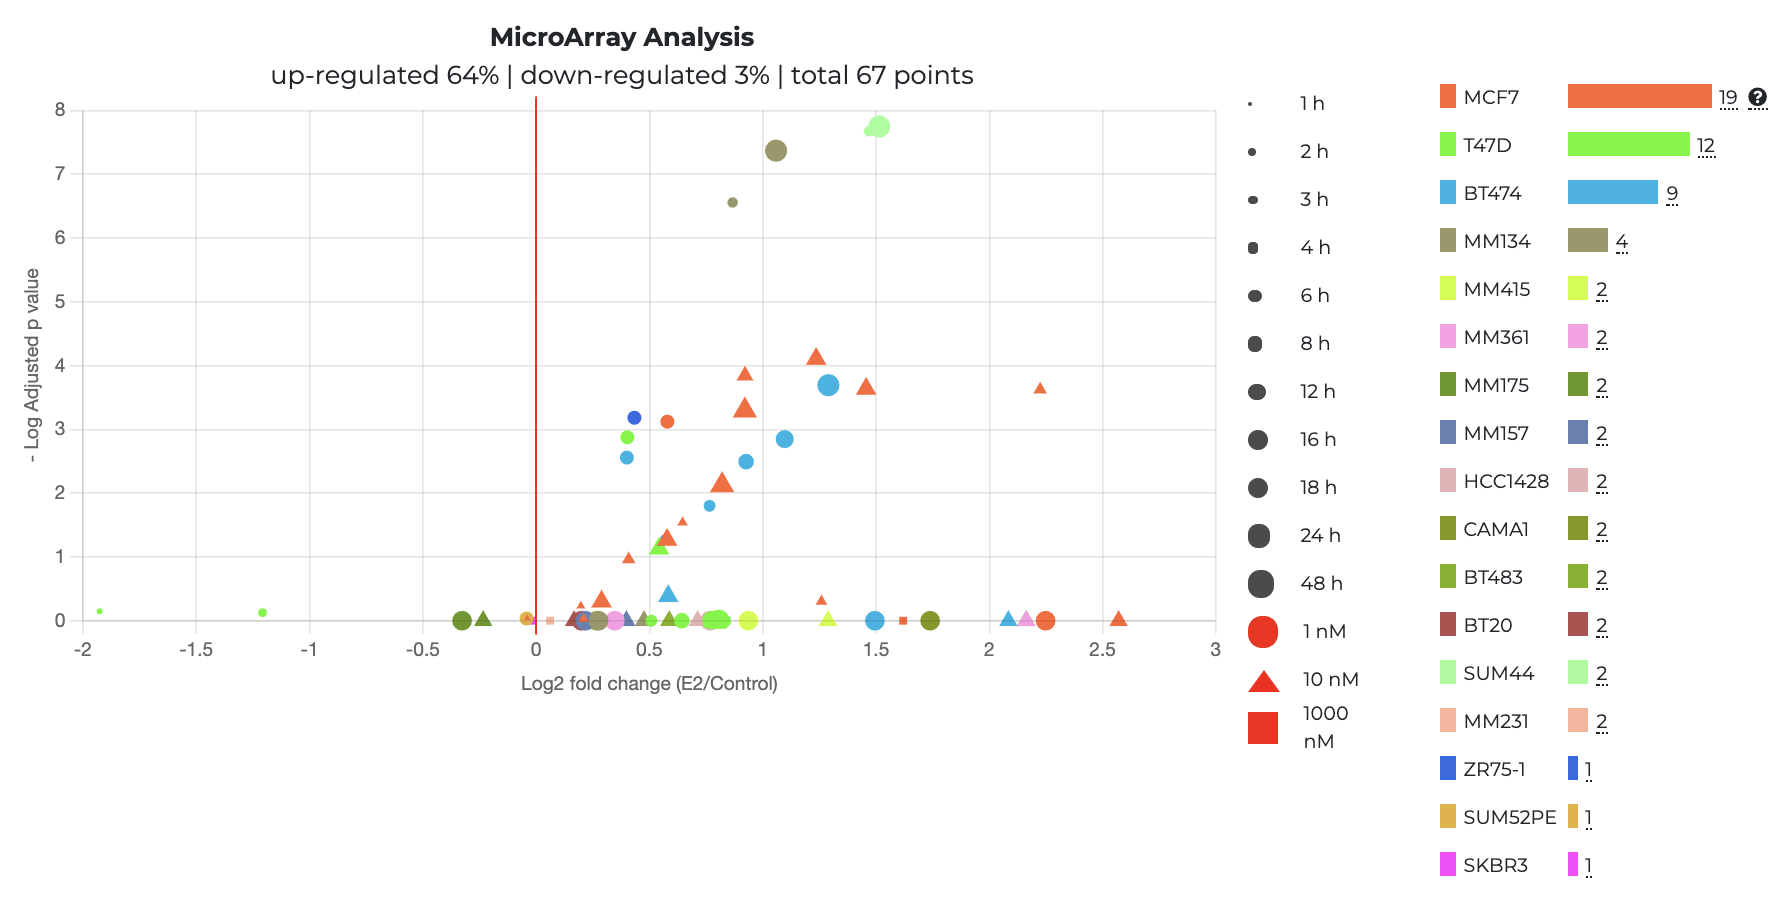
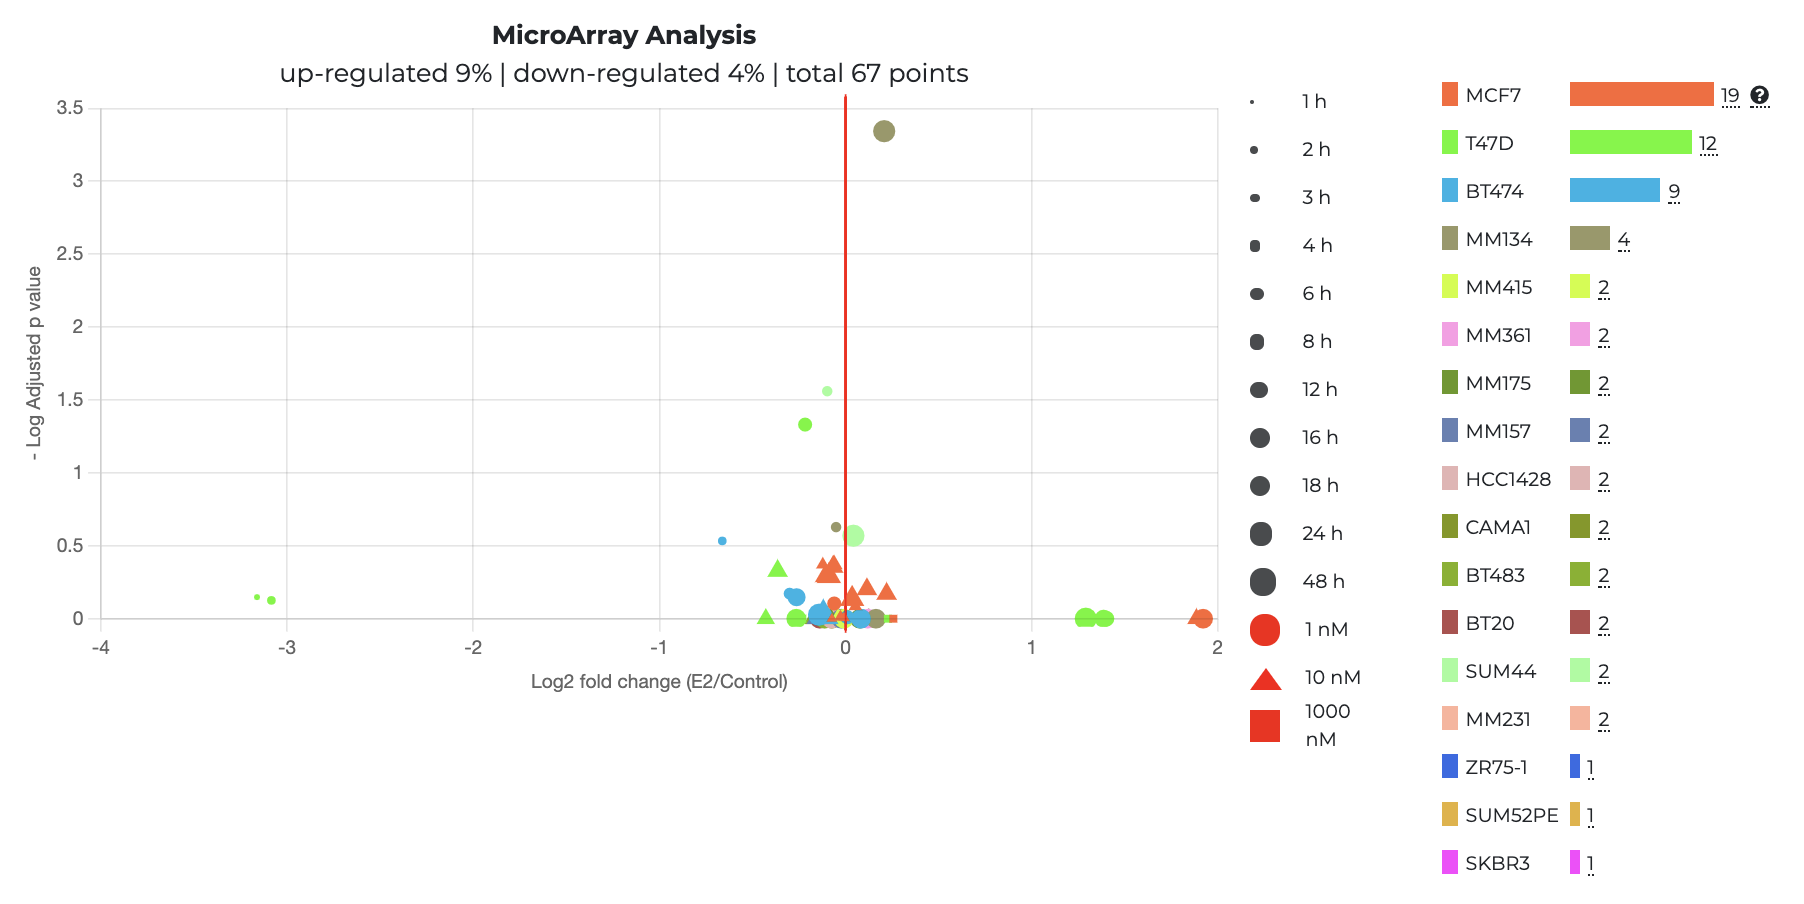
MicroArray analysis
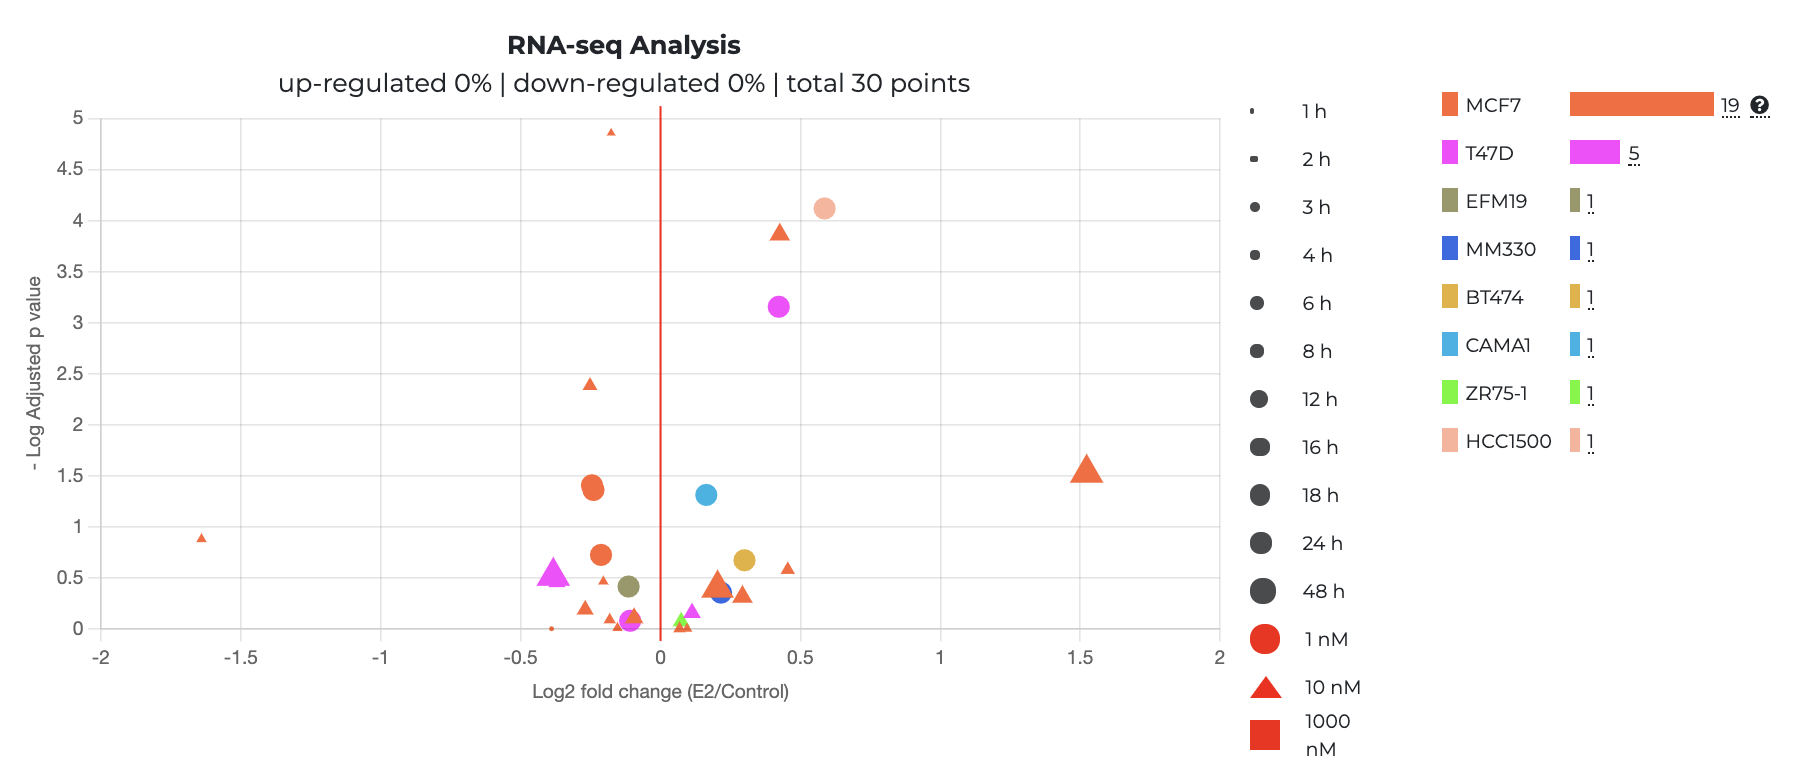
RNA-seq analysis
In addition to MicroArray data, we also conducted analysis on RNA-seq data and provide the corresponding results under MicroArray Section. The filter applies for both RNA-seq and MicroArray data.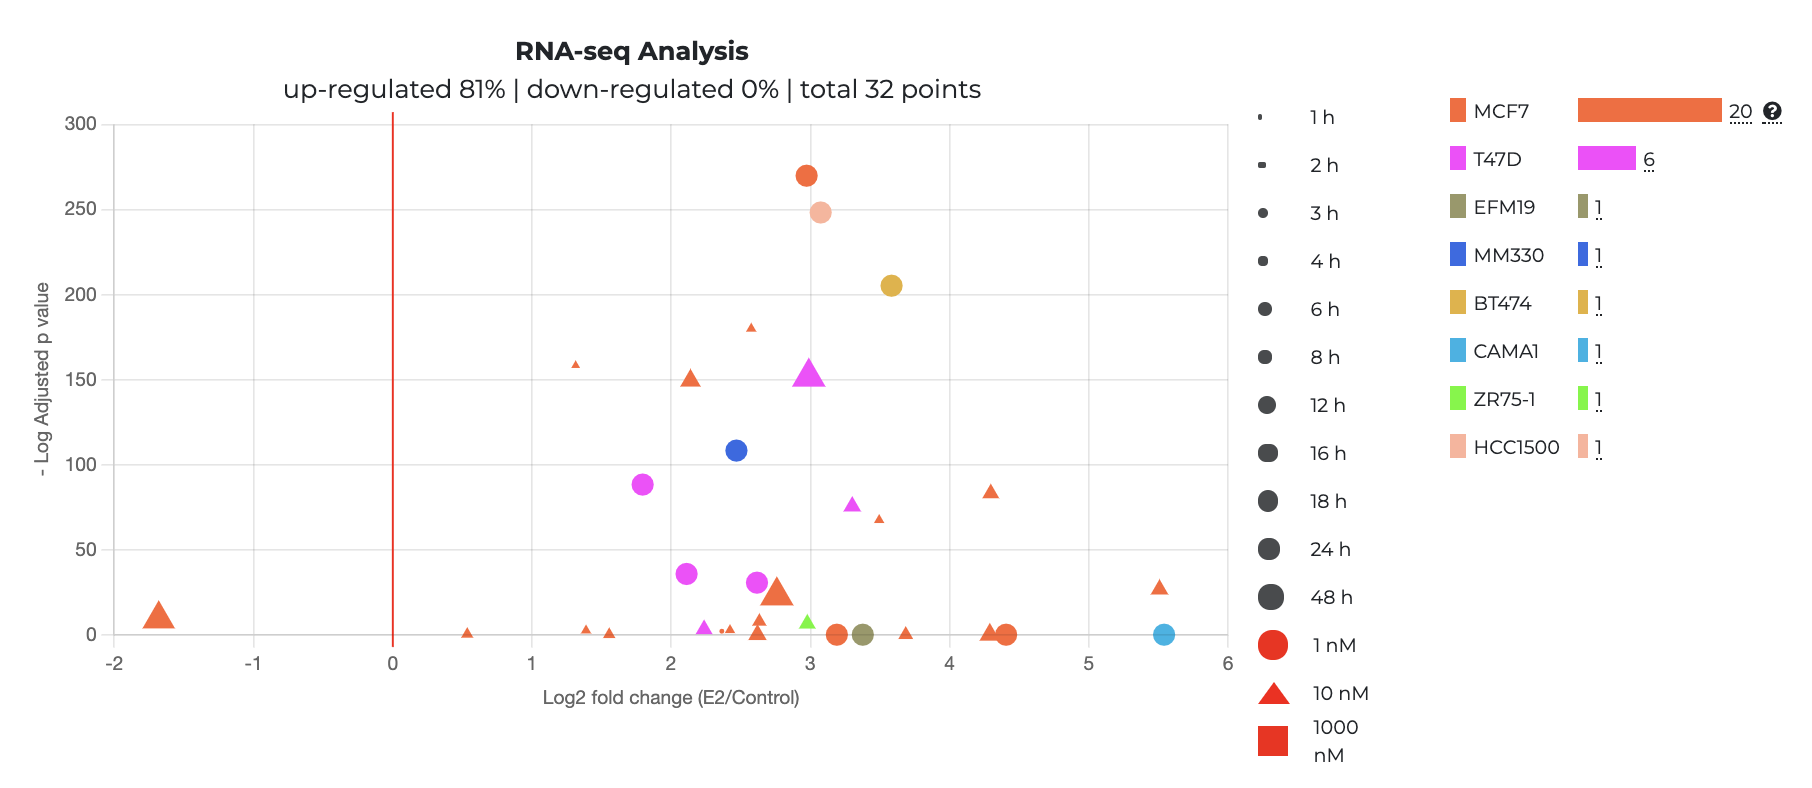
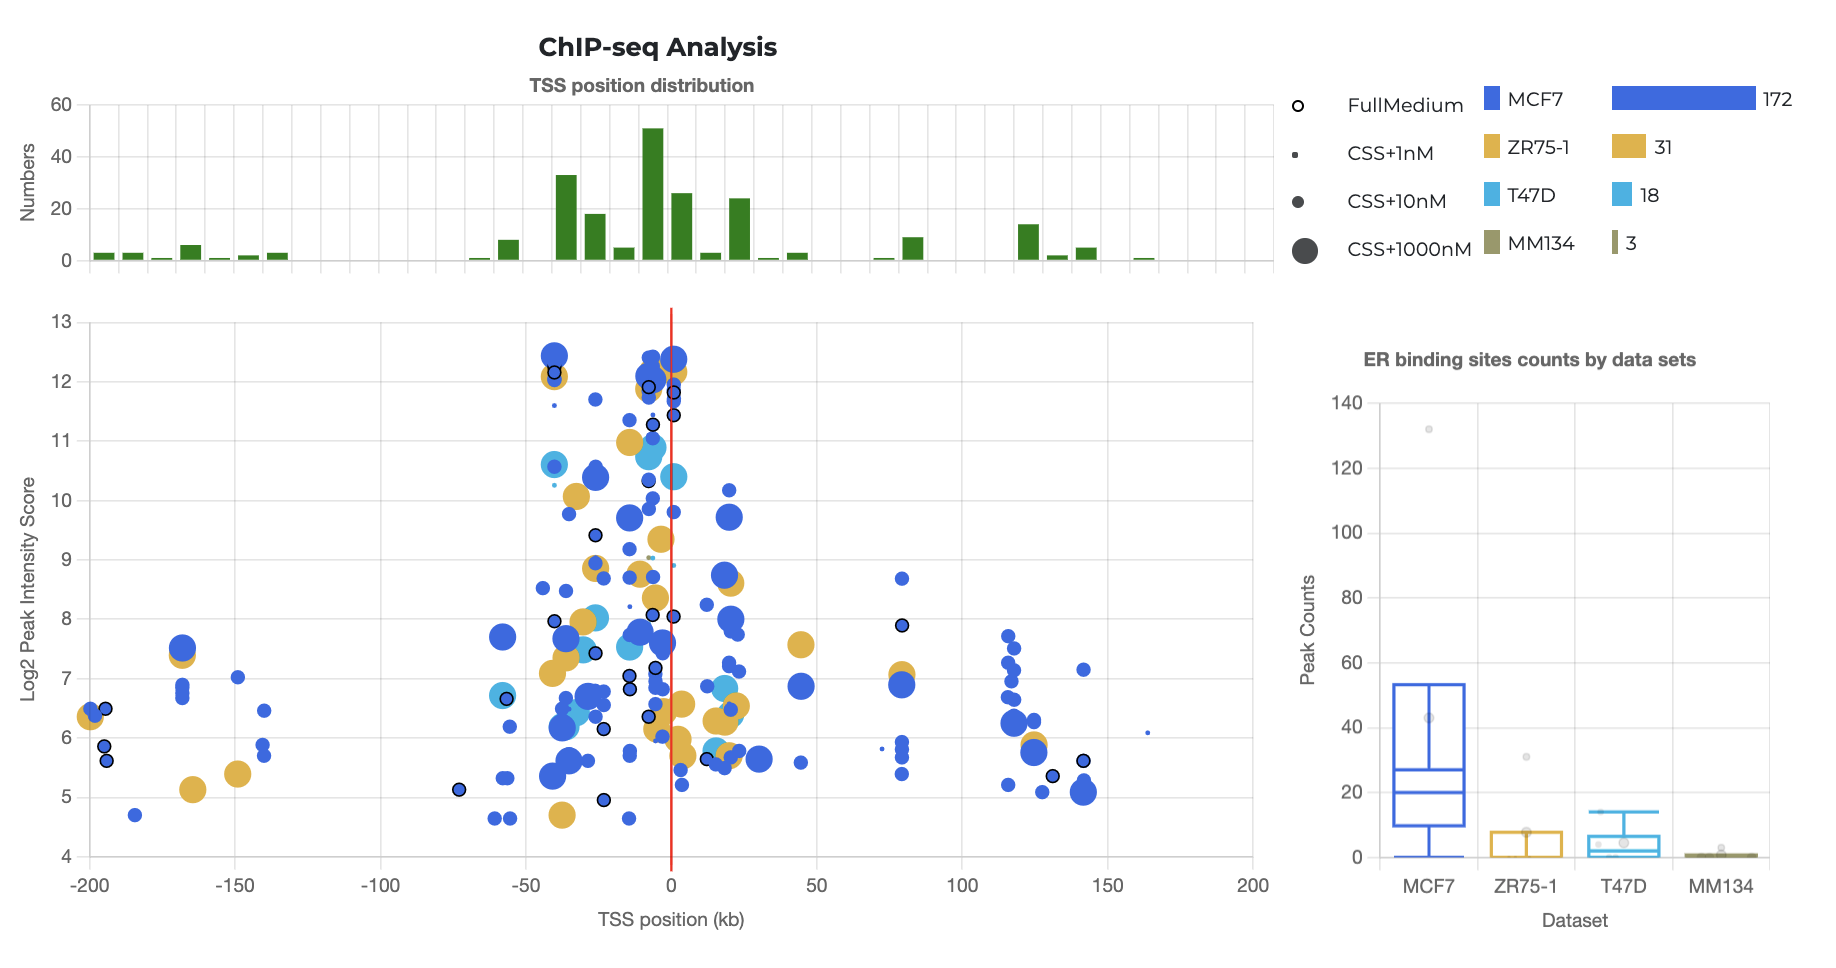
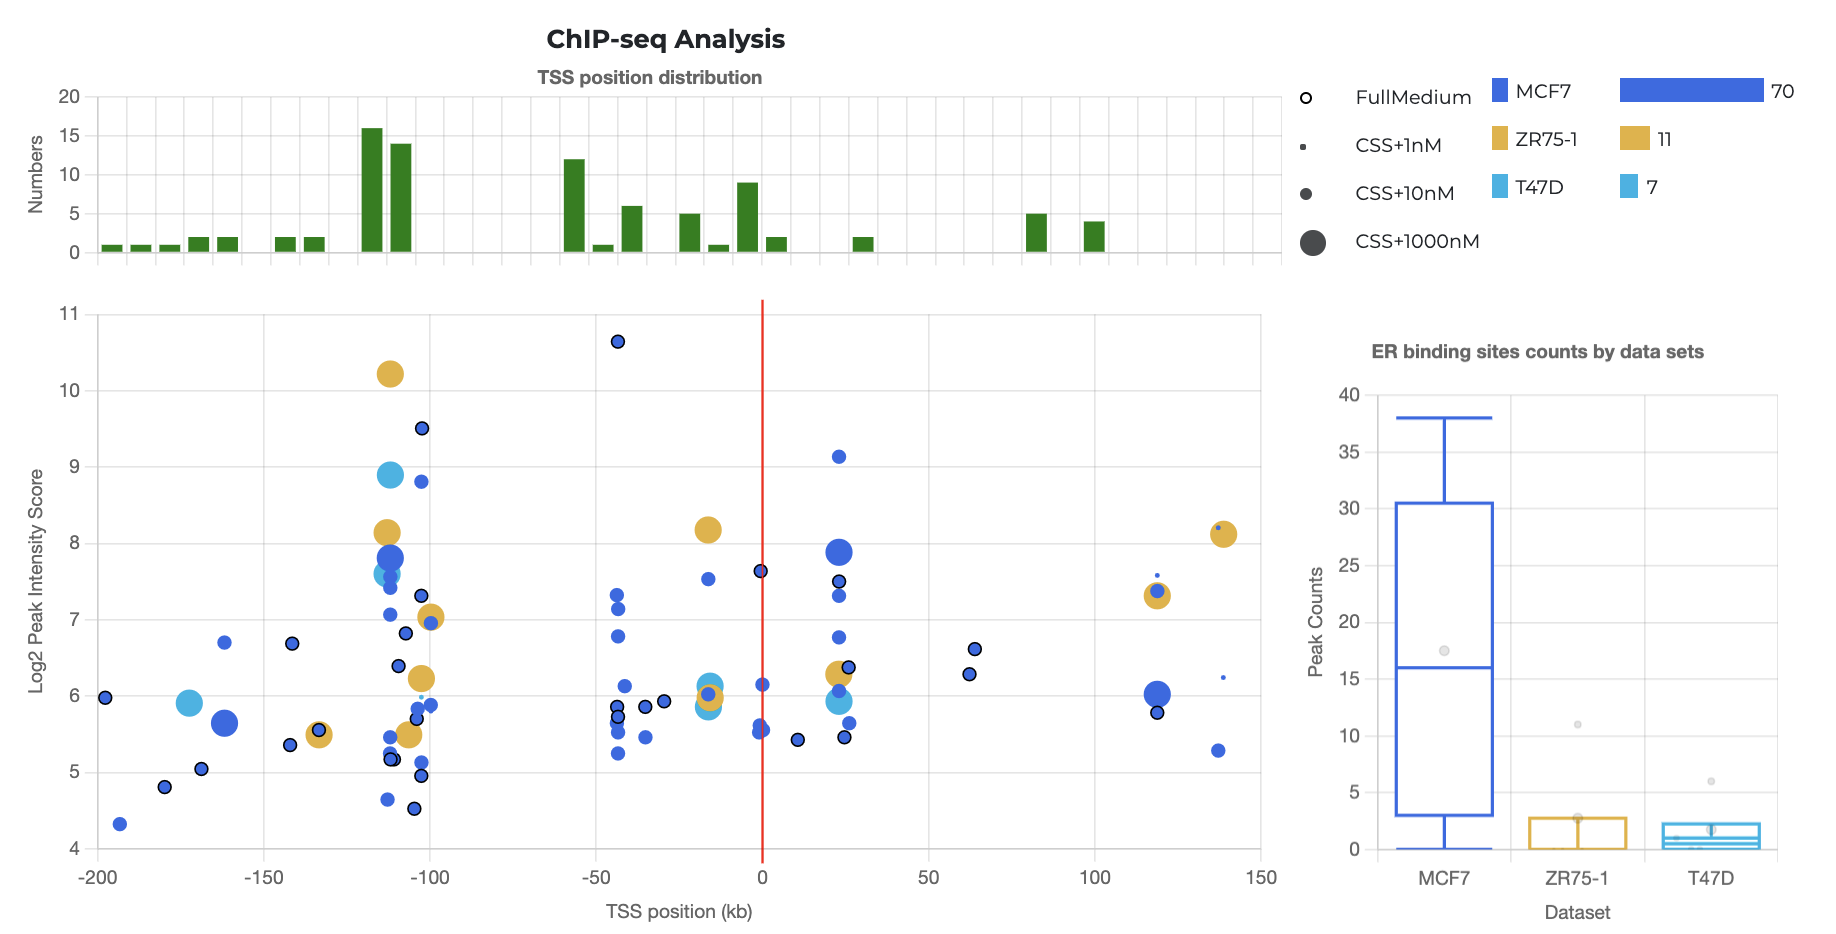
Chip-Seq analysis
Chip-Seq data analysis is also provided in the form of TSS binding sites against its peak calling scores. The dot plot represents the combination of all ER binding sites at the -/+ 200 kb regions around the TSS of the GOF (from either CSS+E2 or full medium groups). Cell lines and conditions are specified. The green histogram summarizes the number of ER binding sites within each 10kb region. We also provided the binding sites quantification of each data set shown as a box plot.
Examples
- Positive Control Gene: GREB1
- Negative Control Gene: ACTB
More Information
You can refer to github page for detail instructions. Or Contact us if you have any questions regarding EstroGeneDB usage.